

W3_Afra_Pareto Analysis
1. Problem
Recognition
Working in
Project Risk Register and update it should be one of the critical work for each
phase process from the owner’s perspective.
To looking at
causes of any problem, decision maker shall use a creative way to do that such
as Pareto analysis because it helps stimulate thinking and organize thoughts
which also known as 80/20 rule -assumes that the large majority of problems
(80%) are determined by a few important causes (20%).
In this blog,
I’ll use Pareto analysis to identify the problem and create a plan to improve
the efficiency for a steam turbine ST-050 which was 90% efficient, and because
of some reasons/issues, it becomes 60% efficient.

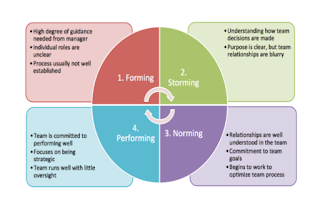
Figure 1 - 4 steps in performing a Pareto Analysis
2. Feasible alternatives
To improve the
efficiency of ST-050 I need to determine the main causes of the problem and
take recovery actions rather than go through each issue separately because there
are more than 30 problems that recorded.
The figure below
shows the ST-050 performance for first 4 months (Feb to May) before applying
any improvement, the figure clearly shows how the production of the steam
turbine (MW) was decreased each month.

Figure 2: ST-050 Performance for first 4
months
Based on the
performance shown, corrective action was required. In this case, Pareto
analysis was conducted to determine the root cause analysis. Once root causes
are found, the issue with the highest impact can be addressed to improve the ST-050
performance.
3.
Development of the outcome of Alternative
To implement
Pareto, all type of problems, a frequency of occurrence, the production loss
for each problem needs to be collected. Then, a list will be produced for all
problem from the major problem to the least problem.
The list of 10
main problems that reduced the efficiency of ST-050 is Blade losses, First stages of the
turbine, Last stage of the LP, Fan losses downstream, Fluid flow, valves,
Piping, Casing, Rotors, and Bearings.
4.
Selection Criteria
The major problems that
cause 85% of all the loss will be listed in Pareto Chart. The rest of the
problems are minor and affecting the performance by 15%.
5.
Analysis and
comparison of the Alternative
Below
Table shows 10 types of major problems that reduce the efficiency of ST-050.

Table 1: Major problems that reduce the
efficiency of ST-050.
The
Pareto chart for the previous table is shown below.

Figure 3: Pareto Chart for Major problems that
reduce the efficiency of ST-050.
6. Selection
of the preferred Alternative
According
to Figure 3 above, the ranks of the first 5 problems (from the major to least
problem) will be Blade losses, Fluid flow, Fan losses downstream, Piping and Last
stage of the LP which contributed to 85% of the total issue. The suggested way
is to find the most effective solution for those top 5 problems to recover the
performance of the ST-050.
7.
Performance Monitoring
and the Post Evaluation of result
Even if the problem
has been solved, monitoring the frequency and occurrence of each problem is
really required so we can understand how effective the solution we did.
In my coming blogs,
I’ll work again to categorized these problems into groups and use other tools
and techniques to identify the root cause of each problem and to make an
improvement plan to solve each group of problems separately.
References:
1.
GUILD OF PROJECT CONTROLS COMPENDIUM
and REFERENCE (CaR) | Project Controls - planning, scheduling, cost management
and forensic analysis (Planning Planet). (2017). Planningplanet.com. Retrieved
20 November 2017, from http://www.planningplanet.com/guild/gpccar/risk-opportunity-monitoring-and-control
2. Pareto Chart in
Excel.
(2017). Excel-easy.com. Retrieved 20 November 2017, from http://www.excel-easy.com/examples/pareto-chart.html
3.
Pareto Analysis Diagram including an example and template
| ToolsHero. (2017). ToolsHero. Retrieved 20 November 2017,
from https://www.toolshero.com/problem-solving/pareto-analysis/


Excellent case study Afra!!! Be sure to remember for Step 7 is that we should do a "before" and "after" Pareto to make sure that whatever interventions we implemented actually solve the problem and didn't just "kick the can down the road" (passing the problems on to someone else)
ReplyDeletehttps://www.qimacros.com/pareto-chart-excel/pareto-analysis/
BR
Dr. PDG, Jakarta