

W4__Hamda__PARETO Analysis__
1- Problem Recognition
During the life of the project and under some phases, there are
some problems may the project will face and they will affect on the life cycle of
the project or the process under each stage. The majority of these problems is
different from one to another depends on the causes of the problem, the effect
of the problem, and the size of its impact on the specific phase and the whole
project. In order to look at the issues and causes of this problem, the decision
maker shall use a perfect and creative tool and technique. One main tool that can be
used in identifying the main causes and issues of any problem is the PARETO
Analysis. In this blog, I will use the PARETO Analysis tool in order to analyze one
main problem that the department face some months while processing the monthly
invoice which is the accuracy of the plant model- Fuel Demand Model (FDM) while
running it- which it is used in calculating the Fuel charge.

1- Feasible alternative
The Pareto Analysis, also known as the Pareto
principle or 80/20 rule, assumes that the large majority of problems
(80%) are determined by a few important causes 20%).The founder of this
analysis, Italian economist Vilfredo
Pareto, discovered this when he was carrying out a study at the end of
the 18th century in which he ascertained that 20% of the Italian population
owned 80% of the property.
In order to use the PARETO analysis in the above mentioned problem, it is important to know the frequency of
occurrence of each cause (the number of time that the department face this
cause), and the impact of such cause on the result of the FDM Run (increase in
the figure-technical element (X figure) - technical element used in calculating the FC- ), which may cause huge deduction on the charge.

Picture from: https://pmstudycircle.com/2015/06/pareto-chart/
1-
Development of the
outcome of Alternative
In the above the case that I mentioned above, in
order to solve the problem and get accurate results from the plant model and
then get accurate calculations in the monthly invoice without facing any
difficulties and to avoid may be any deduction because of the
non-accurate results from the model, it is important to identifying and
determining the main causes and issues that develop this problem. Because
identifying and solving the small causes will help in mitigation or avoiding
the occurrence of the large problem. The main causes of the mentioned problem
are:
-
Problem A: Non-accurate additional data- Gross
data for each GTs, and STs of the whole plant- that is used as inputs data to
the model. (Input data).
-
Problem B: Non-accurate -Net data for each GTs,
and STs of the whole plant- provided in the invoice that used as input data and ambient conditions data.
-
Problem C: Non-accurate of equations developed in
the Model.
-
Problem D: Design of the model.
2- Selection Criteria
There are number of issues that cause the main problem
which is the Non-Accurate Results from the FDM as
I mentioned above. The major issues that cause 90% of all the non-accurate FDM result will
be listed in tables and Pareto Chart. The rest of the issues are minor and
affecting the performance by 10%.
3- Analysis and comparison of the
Alternative
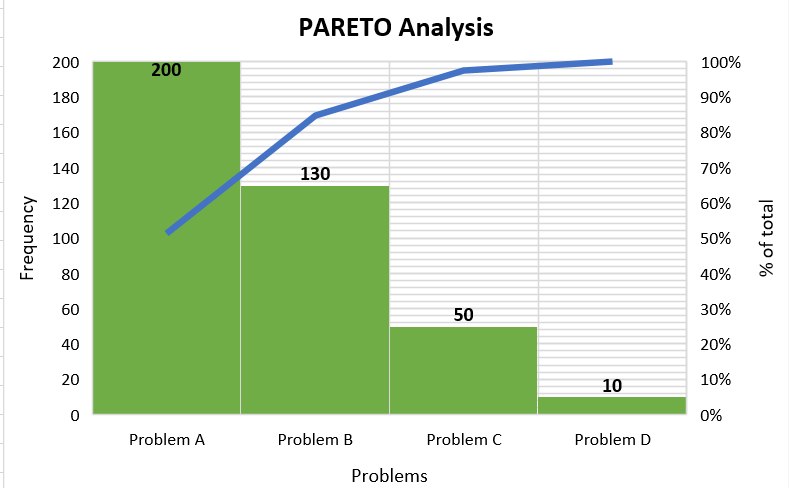
Table 1 shows the
main issues that cause the non-accurate FDM results which affects on the
calculation of on specific charge in the invoice.
Problem
|
Frequency
|
Increase deduction (Cost)
|
Problem
A
|
200
|
30,000
|
Problem
B
|
130
|
14,000
|
Problem
C
|
50
|
5,000
|
Problem
D
|
10
|
2,000
|
Total
|
390
|
51000
|
Note: the data used in table is RANDOM data
(for the purpose of explanation only)
PARETO Chart 1: represent the data mentioned in table 1

Table 2 shows the main issues that cause the
non-accurate FDM results which affects on the calculation of one specific
charge in the invoice. It shows more calculations on the percentage of
occurrence of each issue and the percentage of cumulative of issues.
Problem
|
Frequency
|
% of total
|
Frequency (cumulative)
|
% of total (cumulative)
|
Problem
A
|
200
|
51%
|
200
|
51%
|
Problem
B
|
130
|
33%
|
330
|
85%
|
Problem
C
|
50
|
13%
|
380
|
97%
|
Problem
D
|
10
|
3%
|
390
|
100%
|
Total
|
390
|
100%
|
390
|
100%
|
Note: the data used in table is RANDOM data
(for the purpose of explanation only)
PARETO Chart 2: represent the data mentioned in table 2
1- Selection of the preferred
Alternative
From the above chart, it clear that the first 2 issues
which they are ( non- accurate Gross Data of the units in the plant (GTS, STs),
and the non-accurate NET data of the units and ambient conditions), have the
highest percentage, which indicate that they are the main causes of the
occurrence of the problem. So the one way that can be used in order to mitigate
or avoid the huge deduction which is because of the non-accurate FDM results is
to provide the accurate data of Gross and Net Production of each unit, and
accurate data of the ambient conditions. That mean these data shall be checked
and reviewed before submitted to the FDM.
2- Performance Monitoring and the Post
Evaluation of result
PARETO analysis tool is very helpful technique which
helps the projects manager or the team member (who is responsible of doing such
small projects) to identify the
causes of most of the problems the process is facing. By identifying the causes
of the problem, this will help in reducing the occurrence of the problem or
avoiding the occurrence at all.
Reference:
1- Fahad Usmani
(2017), What is a Pareto Chart?, Retrieved 26 November 2017, from https://pmstudycircle.com/2015/06/pareto-chart/
2- Pareto
Analysis Diagram including an example and template | ToolsHero. (2017). ToolsHero.
Retrieved 26 November 2017, from https://www.toolshero.com/problem-solving/pareto-analysis/
3- GUILD OF
PROJECT CONTROLS COMPENDIUM and REFERENCE (CaR) | Project Controls - planning,
scheduling, cost management and forensic analysis (Planning Planet). (2017).
Planningplanet.com. Retrieved 20 November 2017, from http://www.planningplanet.com/guild/gpccar/risk-opportunity-monitoring-and-control


Great case study Hamda!!! Just remember for Step 7 that you want to do a "before" and "after" Pareto.
ReplyDeleteWhy? Because sometimes what you find out is "fixing" one problem doesn't do anything but "kick the can down the road" meaning all your intervention did was pass the problem from one group or team of people off to another http://www.okstate.edu/sas/v8/sashtml/qc/chap29/images/parex1c.gif
Other than that, you will be well served if you are able to implement the use of this tool on as many of your processes as possible.
BR,
Dr. PDG, Jakarta